Pump Curves for Pump Selection 101
For those in the pump industry, learning how to read a pump curve or performance curve can be incredibly useful if not downright necessary. For us here at JETT Pump, one of the ways we apply our knowledge of pump curves is to size and select the correct pump based on the conditions of a specific fluid process system.
A first look at a pump curve can confusing, in this article we hope to help those who may be checking out a pump curve for the very first time gain some insight into what a pump curve is, how to decipher the information that it charts, and how they can apply to your application. For pumps and fluid processing, it's important to know what a curve is so you can understand the different applications and how they work to give you information about your pump and how it functions.
To start, you’re probably looking at a pump curve because you have an application where there is a tank or well (wet well) full or water or wastewater that is at a lower level than where you want to move it. This is where a pump comes in. A pump is a machine that does not suck... literally. It pumps; it’s used to transfer or move a volume of water or other fluid a certain distance. Each pump is designed to be most efficient at a certain set of design points. To determine which pump will work for your application, you will probably need to consult a pump curve (or JETT Pump & Valve!).
A pump or performance curve looks like a curved line drawn on a grid or graph of vertical and horizontal lines. The curved line represents the performance of a specific pump, the pump will always run somewhere on that curve. The vertical and horizontal lines represent units of measure that help illustrate data indicating a pumps performance at each unit of measure.
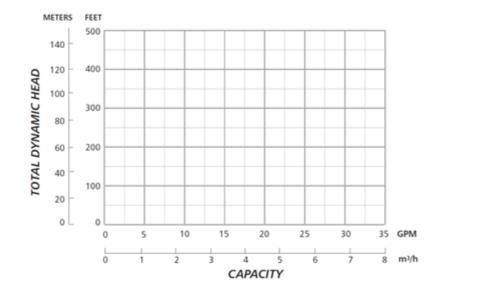
When reading a curve, the x-axis or horizontal line represents flow capacity, typically shown in units of gallons per minute (GPM), this is the volume of fluid that is expressed over a period of time. The y-axis or
vertical line represents total dynamic head (TDH), feet (FT) is the common unit of measure. TDH is the ability of the pump to produce energy creating discharge pressure. Conditions are measured in PSI or pounds per square inch, this reading can then be converted to feet (1psi = 2.31ft). The curve of a pump is plotted on the graph by taking these measurements. Keep in mind, numerous other factors go into what makes up a pump’s performance including the volute size, RPM, and style of pump just to name a few.
Pump manufacturers publish the pump/ performance curves for each series’ model. Frequently, the graphs will show different horsepower (HP) of the same style pump as well as different impeller diameters that will affect where your pump operates on the curve, these options help guide your selection to the best suited pump for your application. Each graph will look a little different depending on the pump or group of pumps that it represents.
Now, remember the hole with fluid in it that you want to move using a pump? Most simply put, the distance and flow of that specific application determine your operating point. There are plenty of other factors that contribute to determining what this point should be also. For example, the size of the well, requirements set in place by the city, population of the area your application is in, and land topography among other various items. That could be a whole other article for another day but you shouldn’t have to get into all that - typically, the operating point (#GPM @ #THD) for your application is determined by the engineer or designer that planned the station and took all of those other factors into consideration. (If you don’t know your operating point, don’t worry, we can help figure it out!)
The pump selected for your application will have a design curve that operates within your maximum operating point. Ideally, on the graph that point should be somewhere near the middle of the curve and close to the line, this is where the pump is most efficient.
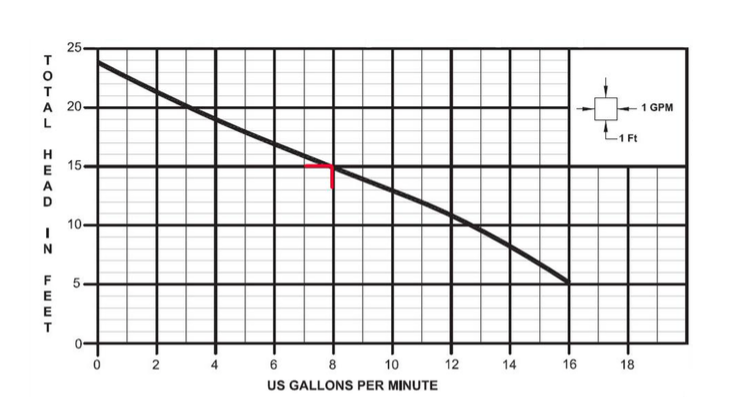
*This pump curve represents a pump that would perform well for an application with an operating point of 8GPM @ 15’TDH
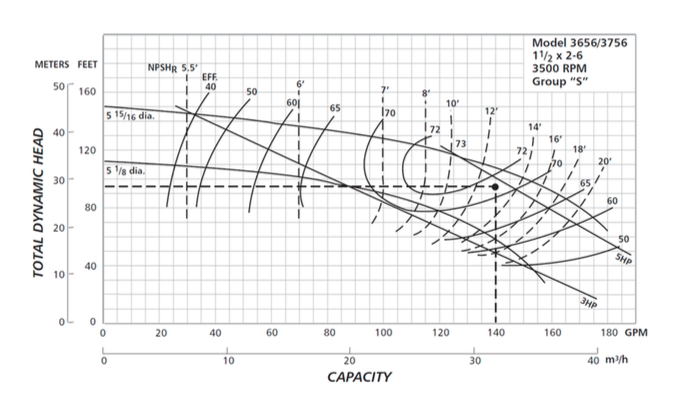
*This pump curve represents a group of pumps. An operating point of 140GPM @ 95’TDH has been selected. The pump at this point would be a 5HP pump. In this curve, we can also determine that the pump would be running at 71% efficiency. To best fit this selected application, the impeller could also be trimmed to 13.
Pump curves can look confusing and sometimes really could be, but understanding the basics can help you ensure that your pump is preforming as it should be or maybe give you some insight into part of how each pump is specially selected for your application.
Need someone to read a pump curve and find you a pump? Let us help! Contact the pump experts at JETT Pump & Valve today!